
Benchmark relative approach
To establish the decarbonisation pathway, we use the economic intensity (GHG Emissions per million euros invested) for target setting. The main consideration for choosing this metric is that it is not influenced by external asset in- and outflows (e.g. total GHG emission targets get distorted by these dynamics) and it makes for easy comparison between assets, investments and portfolios (e.g. total GHG emissions are AuM dependent and as such do not provide direct comparison options). We monitor the absolute emissions as these are important for the total impact of the portfolio. For the decarbonisation pathway, 2019 is the baseline year and decided upon a benchmark-relative approach. This approach uses an acceptable proxy or benchmark to establish the baseline measurement against, which is the opposite of a self-decarbonisation approach that uses a baseline measurement on the portfolio itself.
In our opinion, the benchmark-relative approach provides a number of advantages over the selfdecarbonisation approach:
- When active investment portfolios are established after 2019, it is very difficult to establish a fair baseline measurement when using the self-decarbonisation approach, while proxies or benchmarks can be often established for the baseline year.
- When choosing the self-decarbonisation approach, implicitly portfolios that are already very clean by design in the baseline year are penalised versus portfolios that are very dirty as they both have to realise the same decarbonisation in percentages. A benchmark-relative approach accounts for these differences.

With the described building blocks, a decarbonisation pathway is established for every portfolio. In summary:
- Decarbonisation is measured by economic intensity
- The baseline year of the pathway is 2019
- The baseline measurement for 2019 is based on the benchmark or a representative proxy
- The pathway follows: -50% per the end of 2030 (or annually -6.1%), -50% per end of 2040 (-6.7% annually), and zero GHG emissions after 2040, and till 2050 a compensation strategy when residual emissions are present, after 2050 net zero without the use of a compensation strategy.
Note that it might be necessary to re-establish the decarbonisation pathway by recalculating the baseline intensity of 2019. In the benchmark approach, this generally is triggered if the chosen benchmark/ proxy is not reflective of the portfolio or investment strategy anymore. Annually, Anthos re-assesses if the benchmark/proxies are still reflective of the portfolio or investment strategy.
Reasons for re-baselining are, but not limited to:
- Substantial changes in data coverage, availability, or quality
- A significant shift in the fund’s sectoral or industry exposure
- A benchmark change
- MSCI CVAR
The scenario analysis (the climate ‘value at risk’ method) uses a quantitative approach to provide a forward-looking, return-based valuation assessment for measuring climate-related risks and opportunities for the investments in our portfolios. The quantitative model offers insights into how climate change could affect company valuations across a range of scenario outcomes on a 15-year time horizon. In addition, it indicates our portfolios’ warming potential, a forwardlooking metric that shows the global temperature scenario to which the portfolio is best aligned. This metric is based on the current business activities and emission-reduction targets of the underlying investments if no additional efforts are made to curb GHG emissions or to contribute to climate solutions (technological or otherwise).
Climate Value-at-Risk (‘VaR’)
Broadly speaking, we distinguish three approaches to assessing the degree of climate sensitivity in investment portfolios: top-down (or ‘macro’) approaches, sectorlevel (or ‘meso’) approaches and bottom-up (or ‘micro’) approaches. The MSCI Climate VaR framework used by Anthos provides a coherent methodology, with models and inputs from all three approaches to estimate future climate-related costs and revenues at the securities level. The integration of these three approaches, combined with a strong focus on security-level analysis, makes the method particularly relevant for our active asset management strategies.
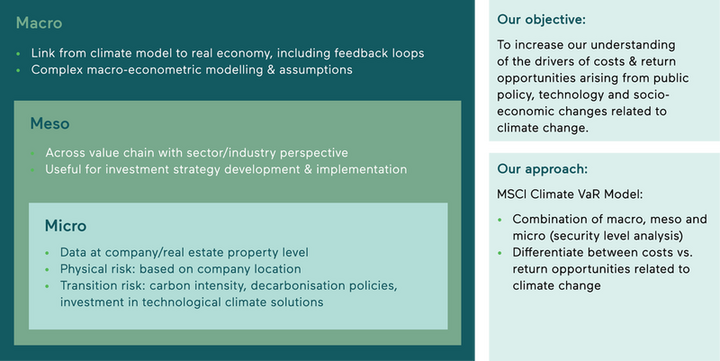
Figure 41: Overview of Climate VaR approach
The approach relies on three core pillars and produces Climate VaR figures for each pillar and each company:
- Physical risks: Potential costs due to physical hazards or climate change-related perils. The physical risks provide insight into how the geolocations of a company contribute, and how vulnerable (or sensitive) the economic activity of the company is, to certain perils (e.g. a transport company will be more affected by snowstorms than an IT company). Two different scenarios – an aggressive and a moderate weather scenario – can be chosen to estimate the physical risks for a portfolio.
- Transition risks: Potential costs of compliance with climate change policies that countries enact in order to decarbonise. The drivers (components) of this risk are the policy effects on emissions directly related to the economic activity (Scope 1); the passthrough policy effects on electricity production and prices (Scope 2), and the policy risks for the whole value chain in which a company operates (Scope 3, divided into upstream and downstream effects). Many different scenario pathways can be chosen to estimate the transition costs.
- Technological opportunities: Opportunities born out of the changes required to meet the transition to a low-carbon economy, based on current lowcarbon revenues and company specific patents. The scenarios for estimating the technological opportunities are the same as those used for the transition risks.
Metrics and measurement methods
A number of basic principles are used at Anthos in measuring emissions, which are the following:
- Measured emissions should always follow the globally accepted Global GHG Accounting and Reporting Standard framework, and cover the seven greenhouse gasses as described by the Kyoto Protocol.
- The framework and definitions of emissions leads to significant amounts of double counting in emissions. This happens between the different emission dimensions (scope 1, 2 and 3), but also between asset classes. For this reason we measure and target the following emissions all strictly separate from each other:
– Scope 1 & 2 for corporates
– Scope 3 for corporates
– Scope 1 to 3 for Real Estate
– Scope 1 to 3 for Sovereigns
- Measurement of portfolio emissions is done on a quarterly basis.
- The attribution factor used to calculate the ownership of GHG emissions:
| Asset Class | Attribution factor |
| Listed companies | Dividing the invested value (equity and/ or debt held) by the Enterprise Value including Cash (EVIC). |
|---|---|
| Private companies | Dividing the invested value (equity + debt held) by the total outstanding equity + total Outstanding debt value. |
| Real estate | Dividing the outstanding amount (the value of the loan or investment on the financial institution’s balance sheet) by the property value at origination of the investment. |
| Sovereign debt | The Purchase Power Parity (PPP)- adjusted GDP for sovereigns to scale ones debt exposure to a bond. |
Climate Metrics
| What | Measure | Aim |
| Absolute Emissions | Metric Tonnes of GHG emissions = tCO2e | Reporting; getting insights on total climate effect of an investment/portfolio |
|---|---|---|
| Economic Emission Intensity | Metric Tonnes of GHG emissions per € million Invested = tCO2e/€ MLN | Reporting; getting insight on climate effect per euro invested as well as being able to directly compare emission across portfolios. Target setting: follow the established decarbonization pathway for every portfolio |
| Weighted Average Carbon Intensity (WACI) (Companies) | Weighted Average of Metric Tonnes of GHG emissions per € million sales = tCO2e/€ MLN | Reporting; getting insight into efficiency of a portfolio per euro earned, to understand exposure to carbon intensive industries (only Companies) |
| Floor Area Weighted Average Carbon Intensity (Real Estate) | Weighted Average of Metric Tonnes of GHG emissions per m2 of property = tCO2e/ m2 | Reporting; getting insight into efficiency of a portfolio per square meter property, to understand exposure to carbon intensive real estate (only Real Estate) |
| Data Quality Breakdown | • % exposure to assets with availability of: reported emissions over the last calendar year (t) and the attribution factor • % exposure to assets with availability of: reported emissions available over the calendar year (t-1) and the attribution factor • % exposure to assets with availability of: estimated emissions over the last calendar year (t) and the attribution factor • % exposure to assets without availability of: any emission figures and/or and the attribution factor | Reporting; getting insights in the reliability of the estimated carbon numbers and how representative they are for the portfolios, assess how it is these figures will still change Target Setting: getting the % exposure of reported to 90% by 2030 |
| Physical risk | VaR figure, expressed in expected return attributable to physical risks for aggressive weather development scenarios | Reporting: getting insights in climate risks |
| Transition risk | Policy VaR figure, expressed in expected return attributable to legal and development costs necessary to be compliant with climate policies at international, national, state level etc.. in three scenarios’ pathways: 1.5⁰C, 2⁰C and lateaction 2⁰C | Reporting: getting insights in climate risks |
| Technological Opportunities | Expected return attributable to opportunities the climate transition brings, in three scenarios’ pathways: 1.5⁰C, 2⁰C and late-action 2⁰C | Reporting: getting insights in climate opportunities |
| Low Carbon Transition Score | Score from 1 to 10, indicating if a company can be considered a climate solution, neutral, risky of stranded | Reporting: getting insights in how the portfolio is distributed from stranded assets to solutions and everything in between. |
Collaborations and initiatives supporting our RI strategy and ambitions
| Organisation | Abbreviation | Summary |
| Partnership for Carbon Accounting Financials | PCAF | PCAF has developed GHG accounting methodologies that apply to any financial institution. The following asset classes are currently covered by the methodology: listed equity and corporate bonds, business loans and unlisted equity, project finance, mortgages, commercial real estate and motor vehicle loans. |
|---|---|---|
| Institutional Investors Group on Climate Change | IIGCC | The IIGCC works with business, policymakers and fellow investors to help define the investment practices, policies and corporate behaviours required to address climate change. It has defined programme areas to address key issues, works closely with other investor groups, and plays a leading role in global investor initiatives on climate change. |
| Dutch Fund and Asset Management Association | DUFAS | The Dutch Fund and Asset Management Association has 50 members, ranging from large (e.g. pension funds) to small, specialised asset managers. DUFAS aims to improve the investment knowledge of the general public and to help implement industry standards. It also advocates for a unified European market, with equal regulation for asset managers. Anthos is active in the DUFAS working groups on the implementation of SFDR and guidance on other EU regulations. |
| Climate Commitment for the Dutch Financial Sector | N/A | The Climate Commitment for the Dutch Financial sector is an agreement between many organisations and companies in the Netherlands to combat climate change. The government’s central goal in the National Climate Agreement is to reduce GHG emissions in the Netherlands by 49% by 2030, compared to the 1990 levels. |
| Principles for Responsible Investment | PRI | In its focus on making ESG part of investment decisions, ownership and reporting, the PRI provides useful guidance for standardising and improving our approach across our asset classes. As well as echoing our values, the PRI helps us to speak our industry’s emerging RI language and frame our activities, including choosing and engaging with our investment managers Reporting to the PRI also helps us to see where we stand relative to our industry. |
| Global Real Estate Sustainability Benchmark | GRESB | GRESB Assessments are guided by what investors and the industry consider to be material issues in the sustainability performance of real asset investments, and are aligned with international reporting frameworks such as GRI, PRI, SASB and DJSI, TCFD recommendations, the Paris Agreement, UN SDGs, and regional and national disclosure guidelines and regulations. |
| Impact Management Project | IMP | The IMP provides a forum for building a global consensus on measuring, managing and reporting sustainability. It is relevant for enterprises and investors wanting to manage ESG risks, as well as for those wanting to contribute to global goals. |
Science Based Targets initiative The Science Based Targets initiative (SBTi) drives ambitious climate action in the private sector by enabling companies to set science-based emissionreduction targets. | SBTi | We have joined a private equity working group with the aim of co-creating a reduction methodology for Anthos as a largely fund-of-funds investor. |
| Global Impact Investing Network | GIIN | We take part in their annual conference, speaking about impact practitioner topics. |
| Task Force on Climaterelated Financial Disclosures | TCFD | The Financial Stability Board established the TCFD to de-velop recommendations for more effective climate-related disclosures that could promote more informed investment decisions and, in turn, enable stakeholders to understand better the concentrations of carbon-related assets in the financial sector and the finan-cial system’s exposures to climate-related risks. In 2023 we have continued to volun-tarily align our climate-related reporting with its recommen-dations. |
| Clean, Renewable and Environmental Opportunities Syndicate | CREO | CREO is an NYC-headquartered 501(c)3 public charity working to invest and catalyse $1 trillion of capital into climate and sustainability solutions towards the decar-bonization transition by 2025. |
| Investor Alliance for Human Rights | The Investor Alliance for Hu-man Rights is a collective action platform for responsible investment that is grounded in respect for people's funda-mental rights. We are a membership-based, non-profit initiative focusing on the in-vestor responsibility to respect human rights, corporate engagements that drive respon-sible business conduct, and standard-setting activities that push for robust business and human rights policies. |
Anthos corporate emissions
| Emission category | Scope | Anthos corporate emissions (tCO2e) |
| Fuel combustion | Scope 1 | 14,42 |
| Company vehicles | Scope 1 | 11,25 |
| Total Scope 1 | Scope 1 | 25,67 |
|---|---|---|
| Purchased electricity (market-based) | Scope 2 | 43,40 |
| Total Scope 2 | Scope 2 | 43,40 |
| Fuel- and energy- related activities | Scope 3 | 58,57 |
| Business travel | Scope 3 | 372,96 |
| Employee commuting | Scope 3 | 22,56 |
| Upstream leased assets | Scope 3 | 149,89 |
| Total Scope 3 | Scope 3 | 603.98 |
| Total Emission | 673,05 |
Source: Anthos Fund & Asset Management.
As at 31 December 2023. Note: Last year, we have undertaken a comprehensive review of our Greenhouse Gas (GHG) accounting methodology. As a result of this review, we have made a significant change in our approach to energy consumption accounting. We have now segregated energy consumption into two distinct categories: individual consumption (falling under Scope 1 and 2) and communal area consumption (falling under Scope 3 Upstream Leased Asset). This is a departure from our previous methodology, where total energy consumption was accounted for under Scope 1 and 2. This modification aligns with the guidelines provided by the GHG Protocol.
Metrics and measurement methods
In 2023, we merged our TCFD reporting into this Annual RI Report. The below table is a guide to help understand where we have incorporated the relevant reporting requirements.
TCFD recommendation disclosures
| TCFD recommendation disclosures | Where reported | ||
Governance Disclose the organization's governance around climate-related issues and opportunities | a. | Describe the board's oversight of climate related risks and opportunities. | Governance of RI at Anthos, ESG and Sustainability risk management |
| b. | Describe the management's role in assessing and managing climate related risks and opportunities. | Governance of RI at Anthos, ESG and Sustainability risk management | |
Strategy Disclose the actual and potential impacts of climate related risks and opportunities on the organization's business, strategy and financial planning where such information is material. | a. | Describe the climate related-risks and opportunities the organization has identified over the short, medium and long-term. | Climate risks & opportunities |
| b. | Describe the impact of climate-related risks and opportunities on the organization's businesses, strategy and financial planning. | Climate risks & opportunities | |
| c. | Describe the resilience of the organization's strategy, taking into consideration different climate-related scenarios, including a 2C or lower scenario. | Resilience of the climate strategy: Climate scenario analysis | |
Risk management Disclose how the organization identifies and assesses and manages climate-related risks. | a. | Describe the organization's processes for identifying and assessing climate-related risks. | ESG and Sustainability risk management |
| b. | Describe the organization's processes for managing climate-related risks. | ESG and Sustainability risk management | |
| c. | Describe how processes for identifying, assessing, and managing climate related risks are integrated into the organization's overall risk management. | ESG and Sustainability risk management | |
Metrics and targets Disclose the metrics and targets used to assess and manage relevant climate related risks and opportunities where such information is material. | a. | Disclose the metrics used by the organization to assess climate-related risks and opportunities in line with its strategy and risk management process. | Metrics and targets used to assess and manage climaterelated risks and opportunities |
| b. | Disclose Scope 1, Scope 2, and, if appropriate, Scope 3 GHG emissions, and the related risks. | Metrics and targets used to assess and manage climaterelated risks and opportunities | |
| c. | Describe the targets used by the organization to manage climate related-risks and opportunities and performance against targets. | Metrics and targets used to assess and manage climaterelated risks and opportunities | |
Figure 41: TCFD recommendation disclosures
27Anthos uses all of these metrics as part of our proprietary climate strategy with further detail available on request.

Next page
Credits